Waterfall Charts in R
Sunday May 23, 2010

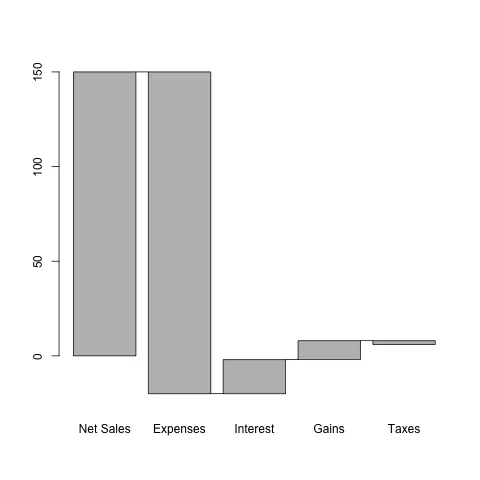
It is often hard to wrap your head around the finances of organizations and the unusual accounting rules of public organizations make that even more difficult. When I read The McKinsey Way several years ago, I saw the value in using waterfall charts to analyze and understand the finances of public organizations. So I created functions for plotting waterfall charts using both traditional and grid graphics in R. Here’s an example using the sample data from The McKinsey Way:
More advanced examples are available in the package demo. I had intended to write the documentation and submit it as a code snippet to the Journal of Statistical Software. However, I have yet to actually write the documentation and it is probably not appropriate for JSS, anyway. Otherwise, the package is complete and is now available from CRAN. The source code is available from Bitbucket. The code repository contains the outline of an Eclipse project using StatET, which I recommend for working with this and all other R packages.